01 · Cost falls
−32%1
travel and hotel cost per meeting, at the location Convien found
Reference location
100
Convien location
68
32 freed
Index, reference location = 100
No AI slop. Real fares, real connections and 15+ years of algorithm development.
Enterprise
Sales kick-offs, trainings, leadership meetings: wherever you are free to choose the place, the place decides the cost. We find the best one from where your people start, with no new system and no change to your travel policy.

Same budget, more meetings
01 · Cost falls
−32%1
travel and hotel cost per meeting, at the location Convien found
Reference location
Convien location
Index, reference location = 100
02 · Capacity rises
+47%2
more meetings from the same budget, because each one costs less
Reference location10 meetings
Same budget, Convien14.7 meetings
03 · Meetings convert
1.8×3
more prospects become customers with an in-person meeting
The savings stay in the budget: 47% more in-person meetings, which convert 1.8× better than none.
1) Client in the pharmaceutical industry, compared with the reference location named by the client. 2) Illustrative: constant budget and cost per meeting, 1 ÷ 0.68 = 1.47. 3) Oxford Economics survey of frequent business travellers (Nov 2012, n=300) for the U.S. Travel Association, 2013: 42 of 100 prospects converted with an in-person meeting, 23 of 100 without (42 ÷ 23 = 1.8); US data, industry-commissioned.
Your potential
Savings calculator
Shows your savings potential
Optimisable share (expected)
30%
€1,500,000
Potential savings per year
Or up to 47% more meetings from the same meeting budget.
Expected: a better location saves 30% of meeting-related travel spend, in line with our up to 35% lower travel cost. Your own data gives the exact figure. Capacity: at a client in the pharmaceutical industry, 32% lower travel and hotel cost per meeting paid for 47% more meetings with the same budget (1 ÷ 0.68).
Retrospective meeting analysis
Your own data, not an estimate. What each past meeting could have saved in travel cost, CO2 and travel time.
Start with your own meetings: proof from your real data before you roll out.
An individual case study of your past location choices, based on your real meetings and events. Each meeting is shifted into the future with the same duration, weekdays and season, so prices and connections stay realistic. We compare the actual location, your alternatives and the best locations our engine finds.
A short call to agree scope and data format, then one data hand-over. We do the rest.
Request your retrospective analysisCO2
A better location shortens the trips of the whole group: up to 42% less CO2 for the same meeting, towards your SBTi targets and ready for ETS2.

Made for your programme
The answer is there before the invitation goes out.
Every calculation uses them.
Travel cost and CO2 saved against your benchmark location, per meeting.
City level only, nothing personal, easy for data protection.
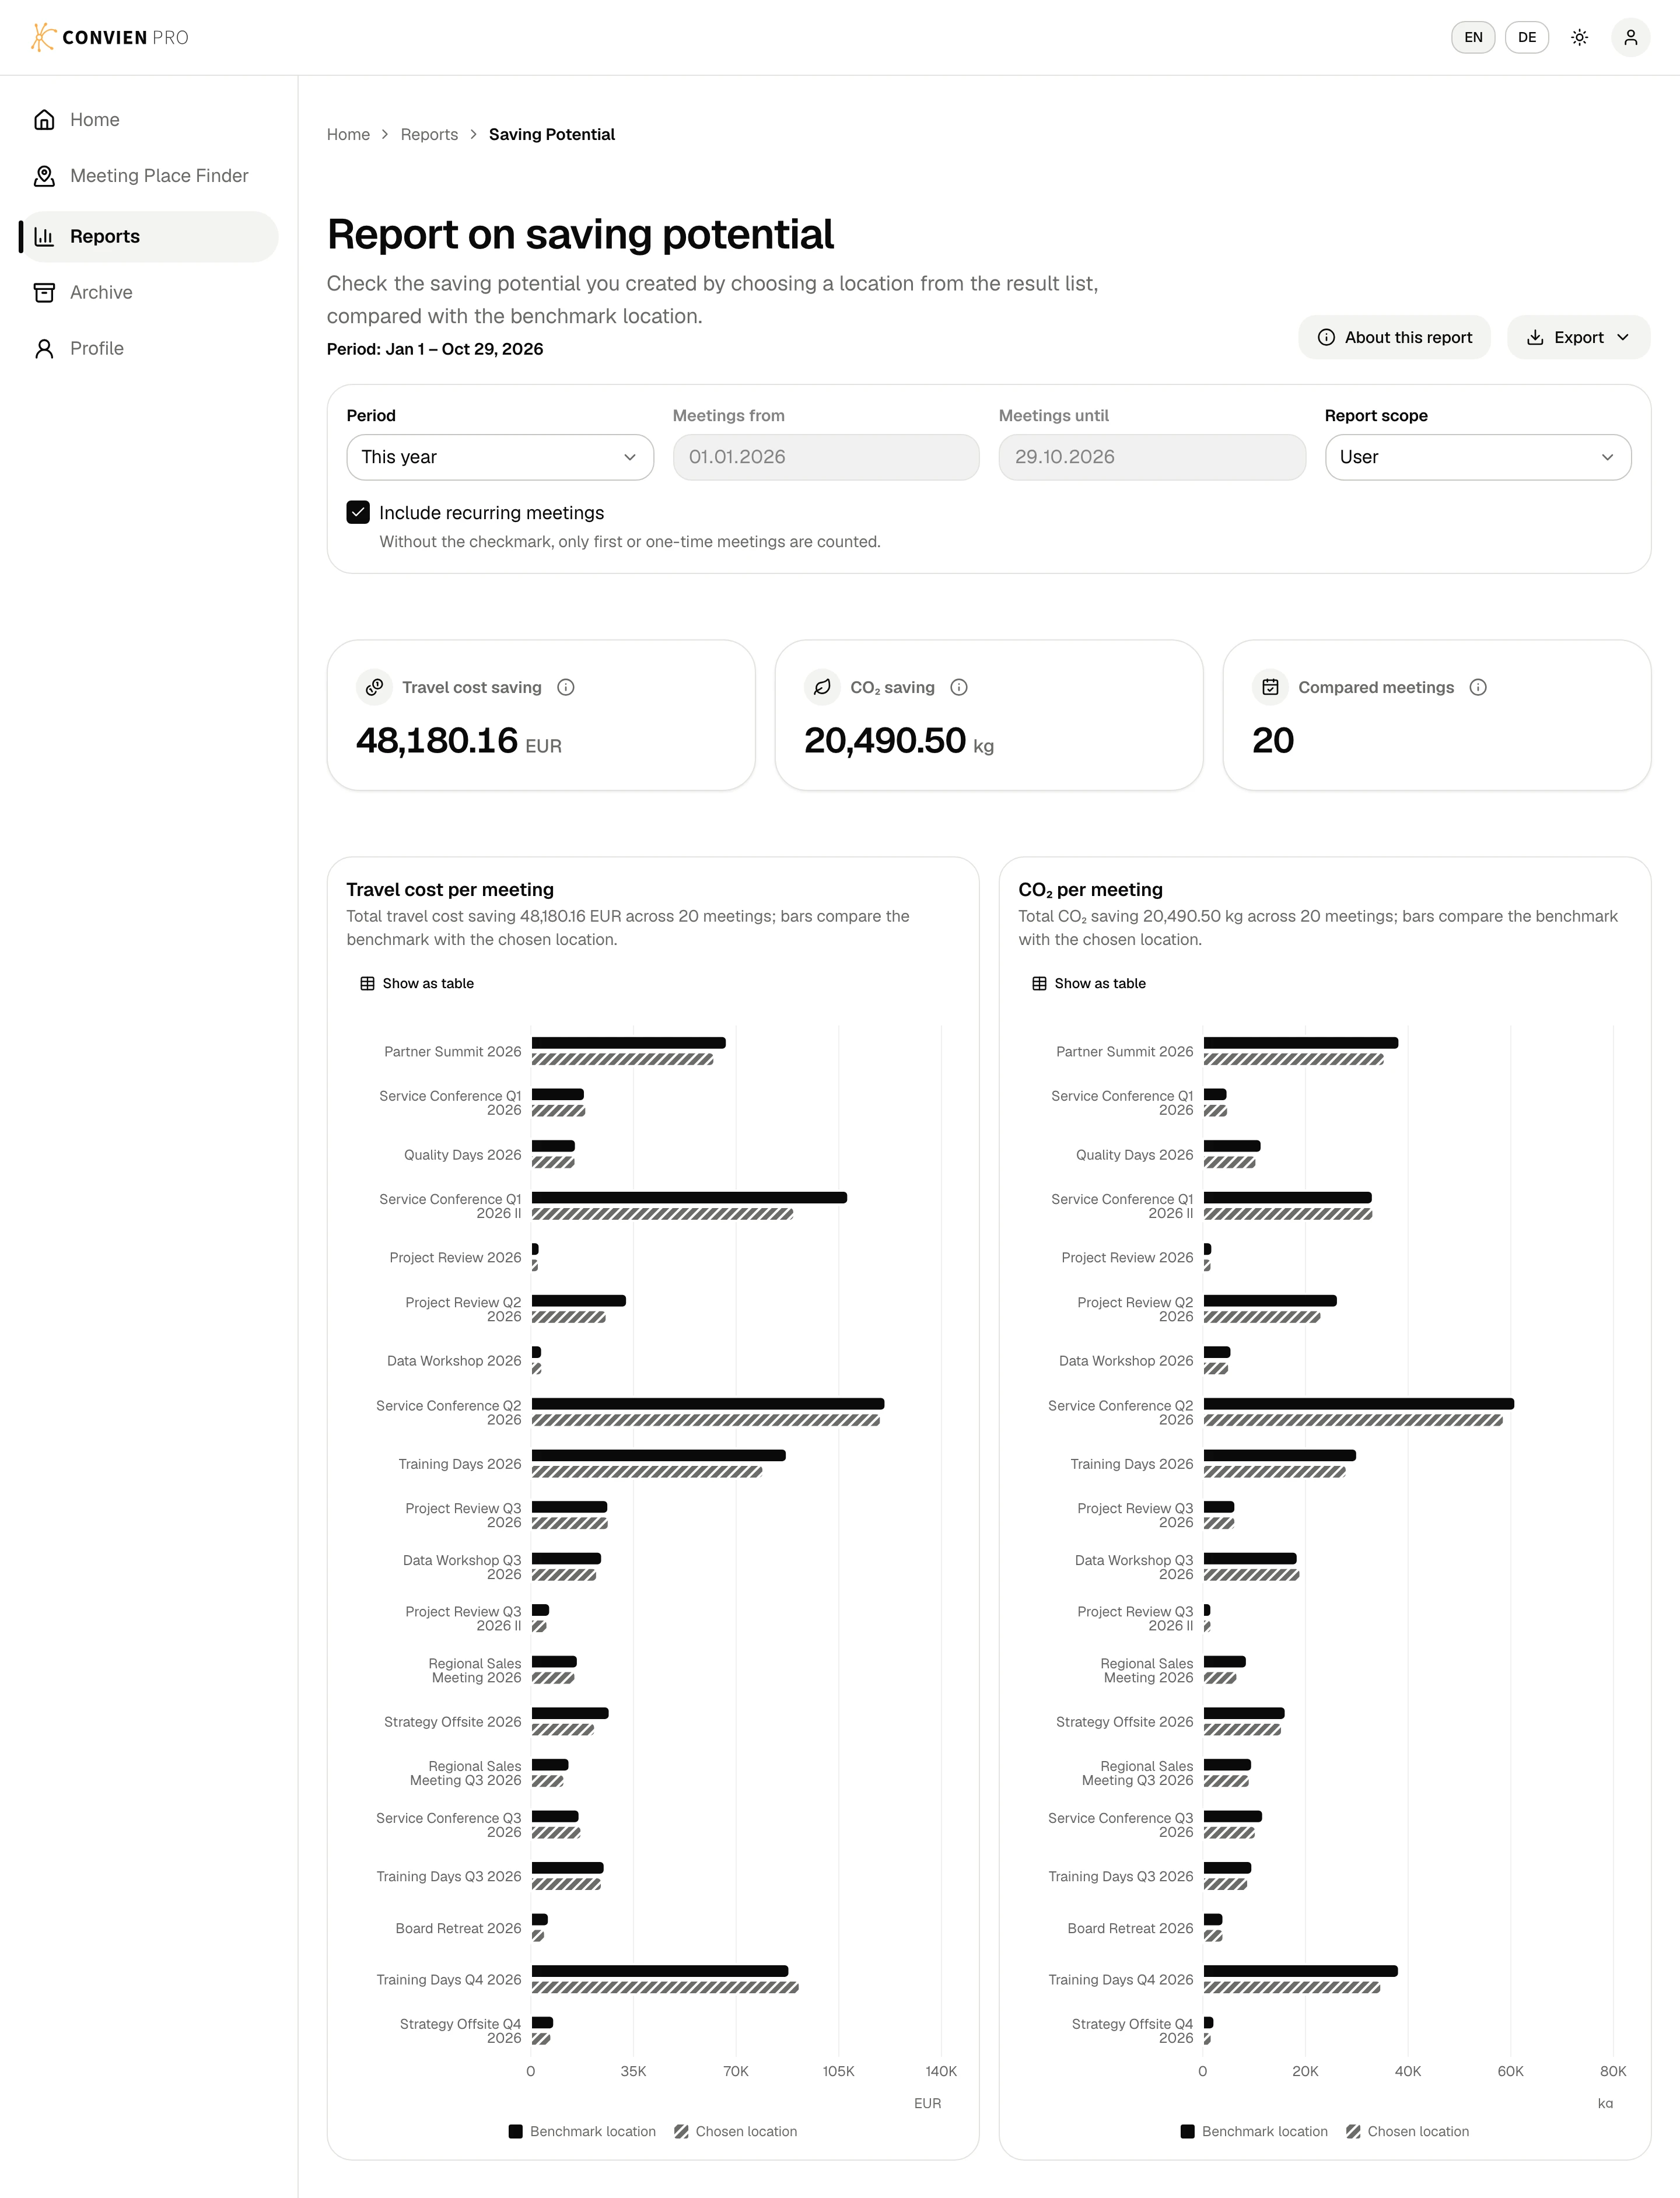
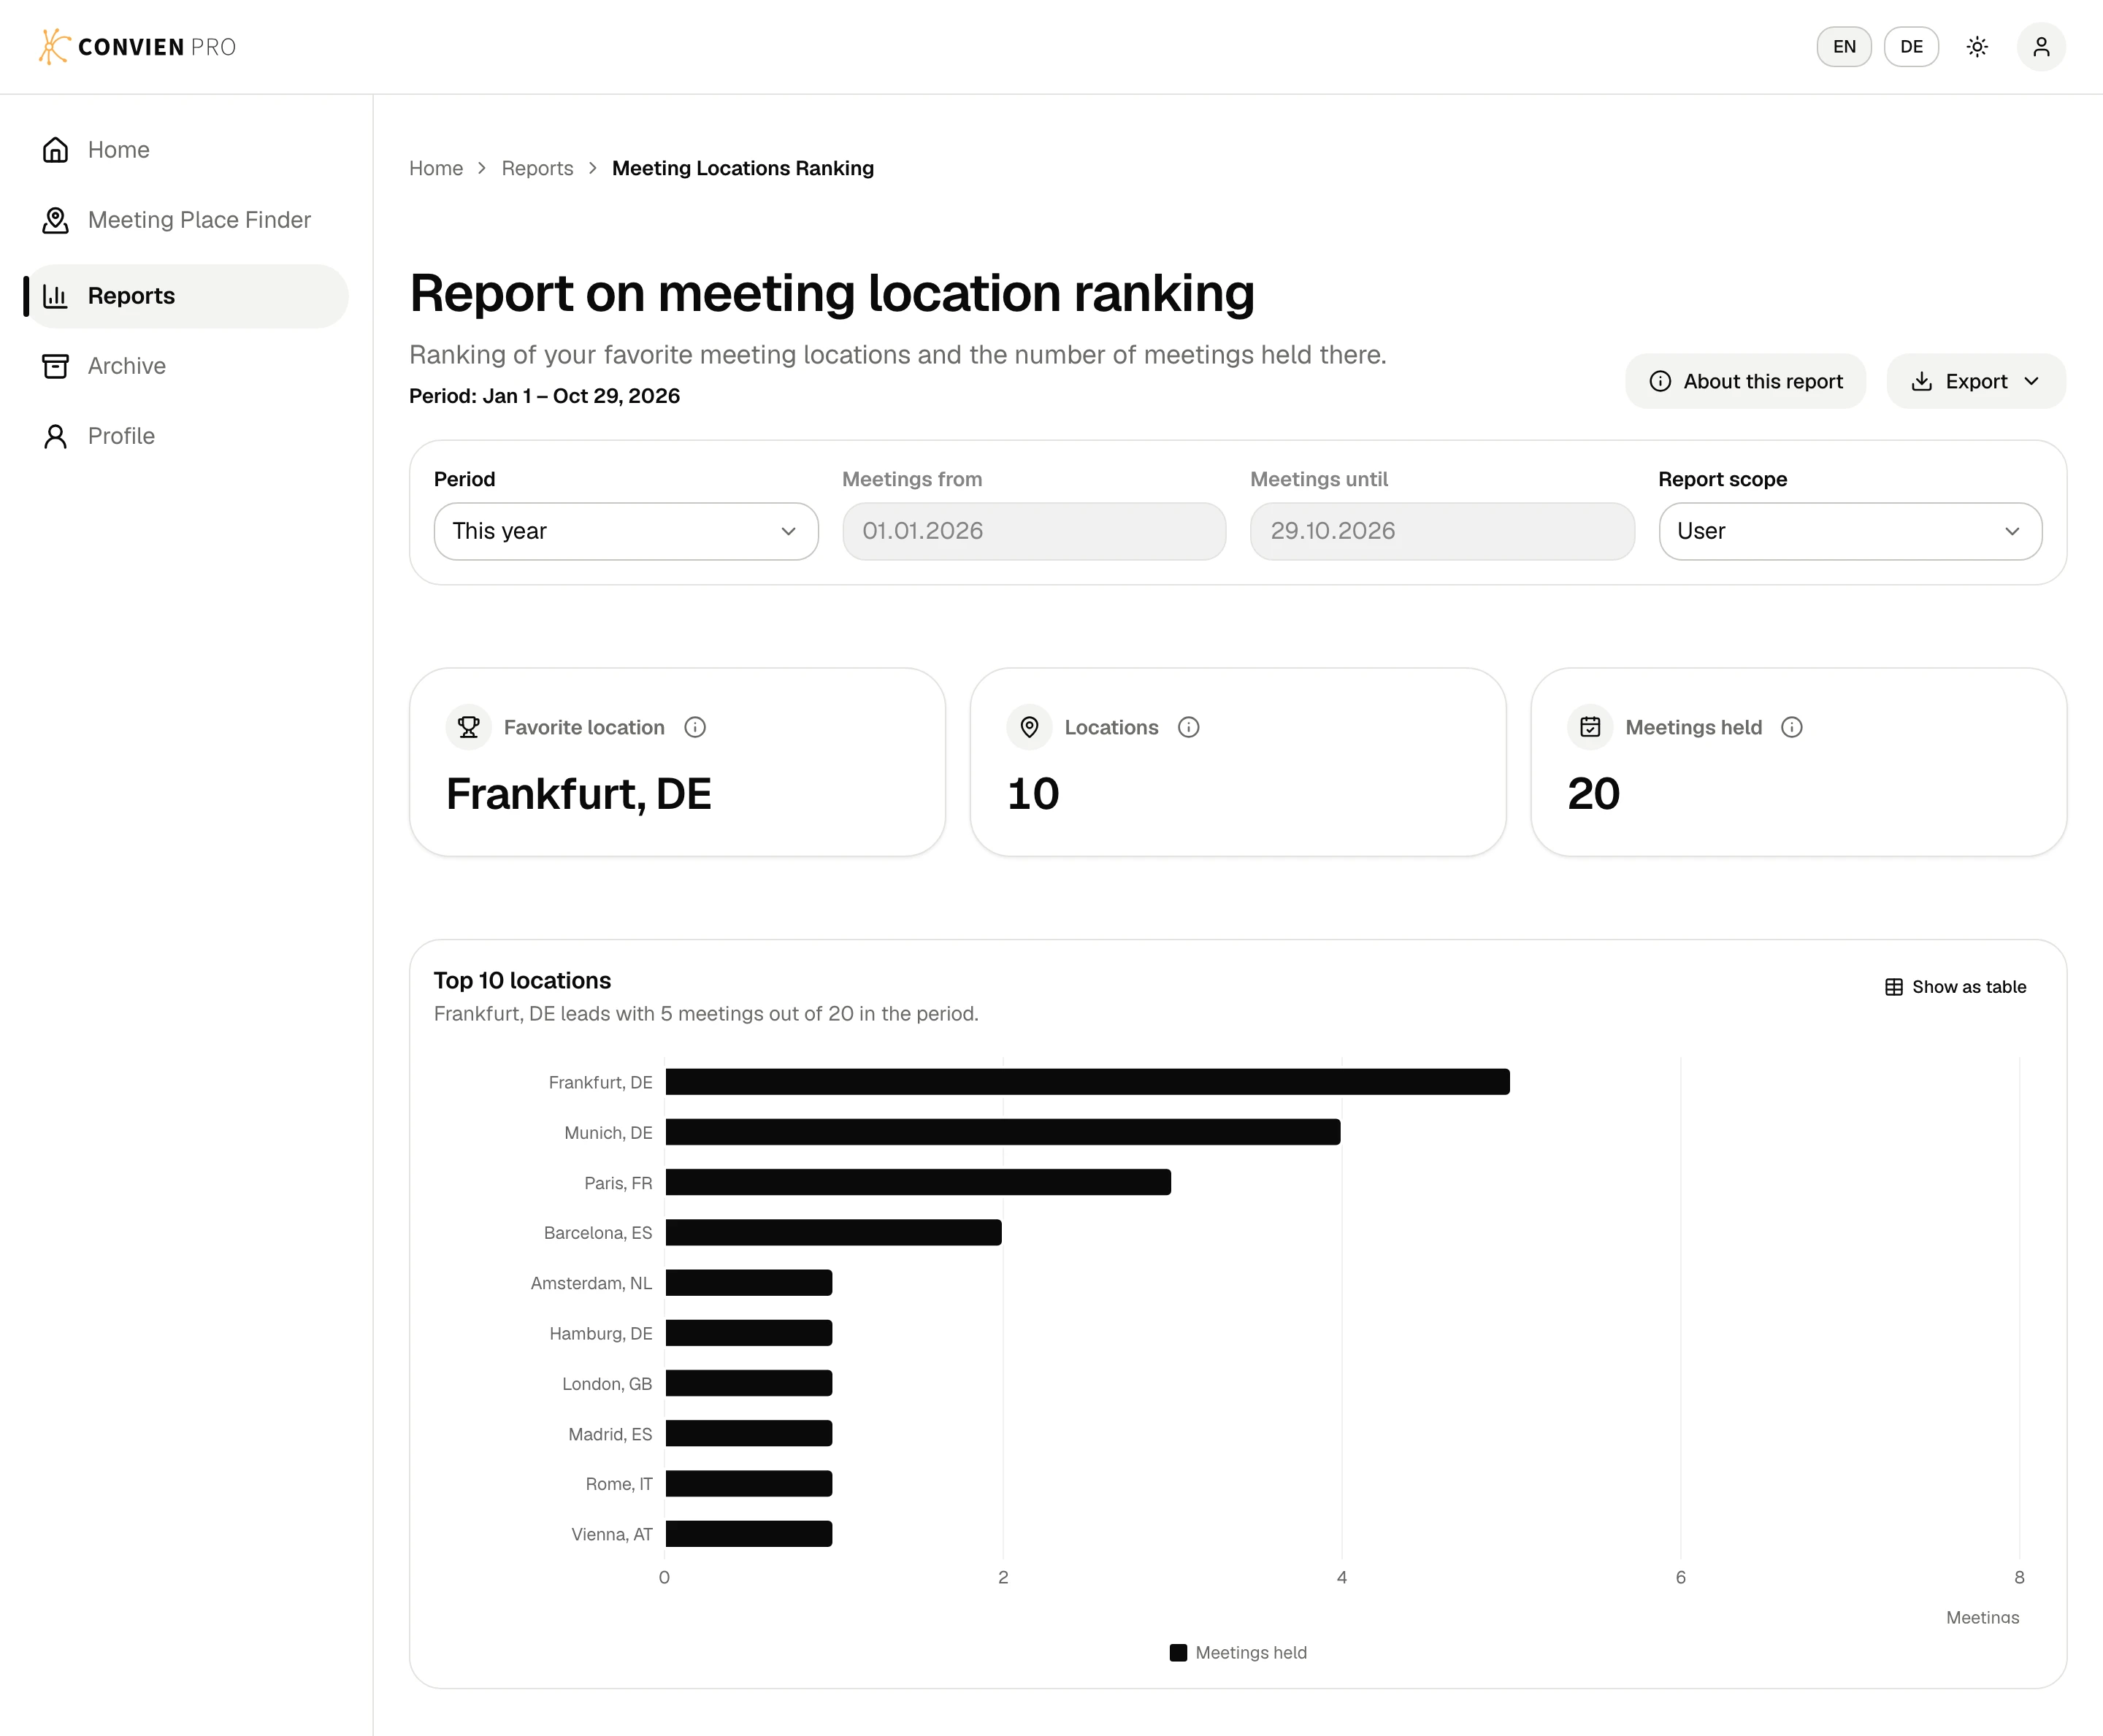
Benefits
One decision instead of forty bookings.
Negotiated rates work where meetings actually happen.
A number on both sides of every decision.
Lower CO2 without restricting meetings, towards your SBTi targets and ready for ETS2.
Integrations
Tell us about your meeting programme. We show you what a better location saves.