How it works
How it works and how we calculate.
Every result rests on the trip of every attendee to every candidate city, with travel cost, travel time and CO2 side by side. Here is how we get there.

Technology
One engine behind every channel.
Web app, Outlook add-in and API share one destination logic; flight, hotel, routing and emissions data are live.
Geocoding and routing
Addresses, distances, door-to-door legs
Global distribution systems
Live flight fares and availability
Flight schedules
Every connection, every day
Emissions
CO2 per trip, VDR standard
- Web app
- Outlook add-in
- Partner API
Convien engine
Service layer
REST services, access control, orchestration
Business layer
Destination logic, door-to-door trips, policies, CO2
Data layer
Resource system, customer data, caches
Hospitality
Hotels and meeting venues
Weather
Typical weather for the dates
Resource data
Airlines, airports, currencies, cities
- 11
- data services connected live
- 1 engine
- for web app, Outlook add-in and API
- 48 modules
- hosted in Germany
Every channel uses the same destination logic, trip building and CO2 calculation.
Four steps
From an attendee list to a decision.

1
Add attendees.
Where they start and how many travel from each place. A city, a postcode or an airport is enough. No names.

2
Choose dates.
Up to three dates: your date plus two alternatives. More dates give more room to save.

3
Calculate.
Check your preferred location, or let us calculate every candidate city.
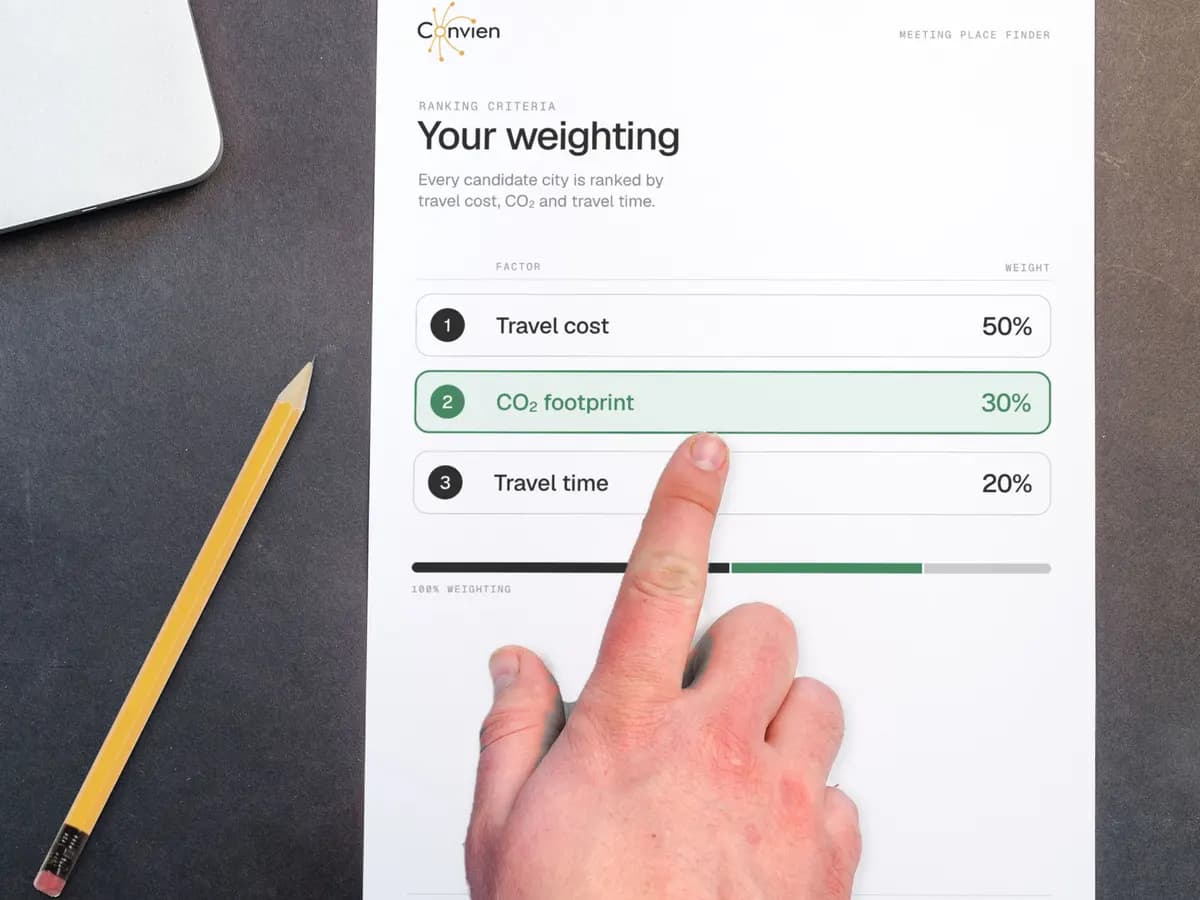
4
Decide.
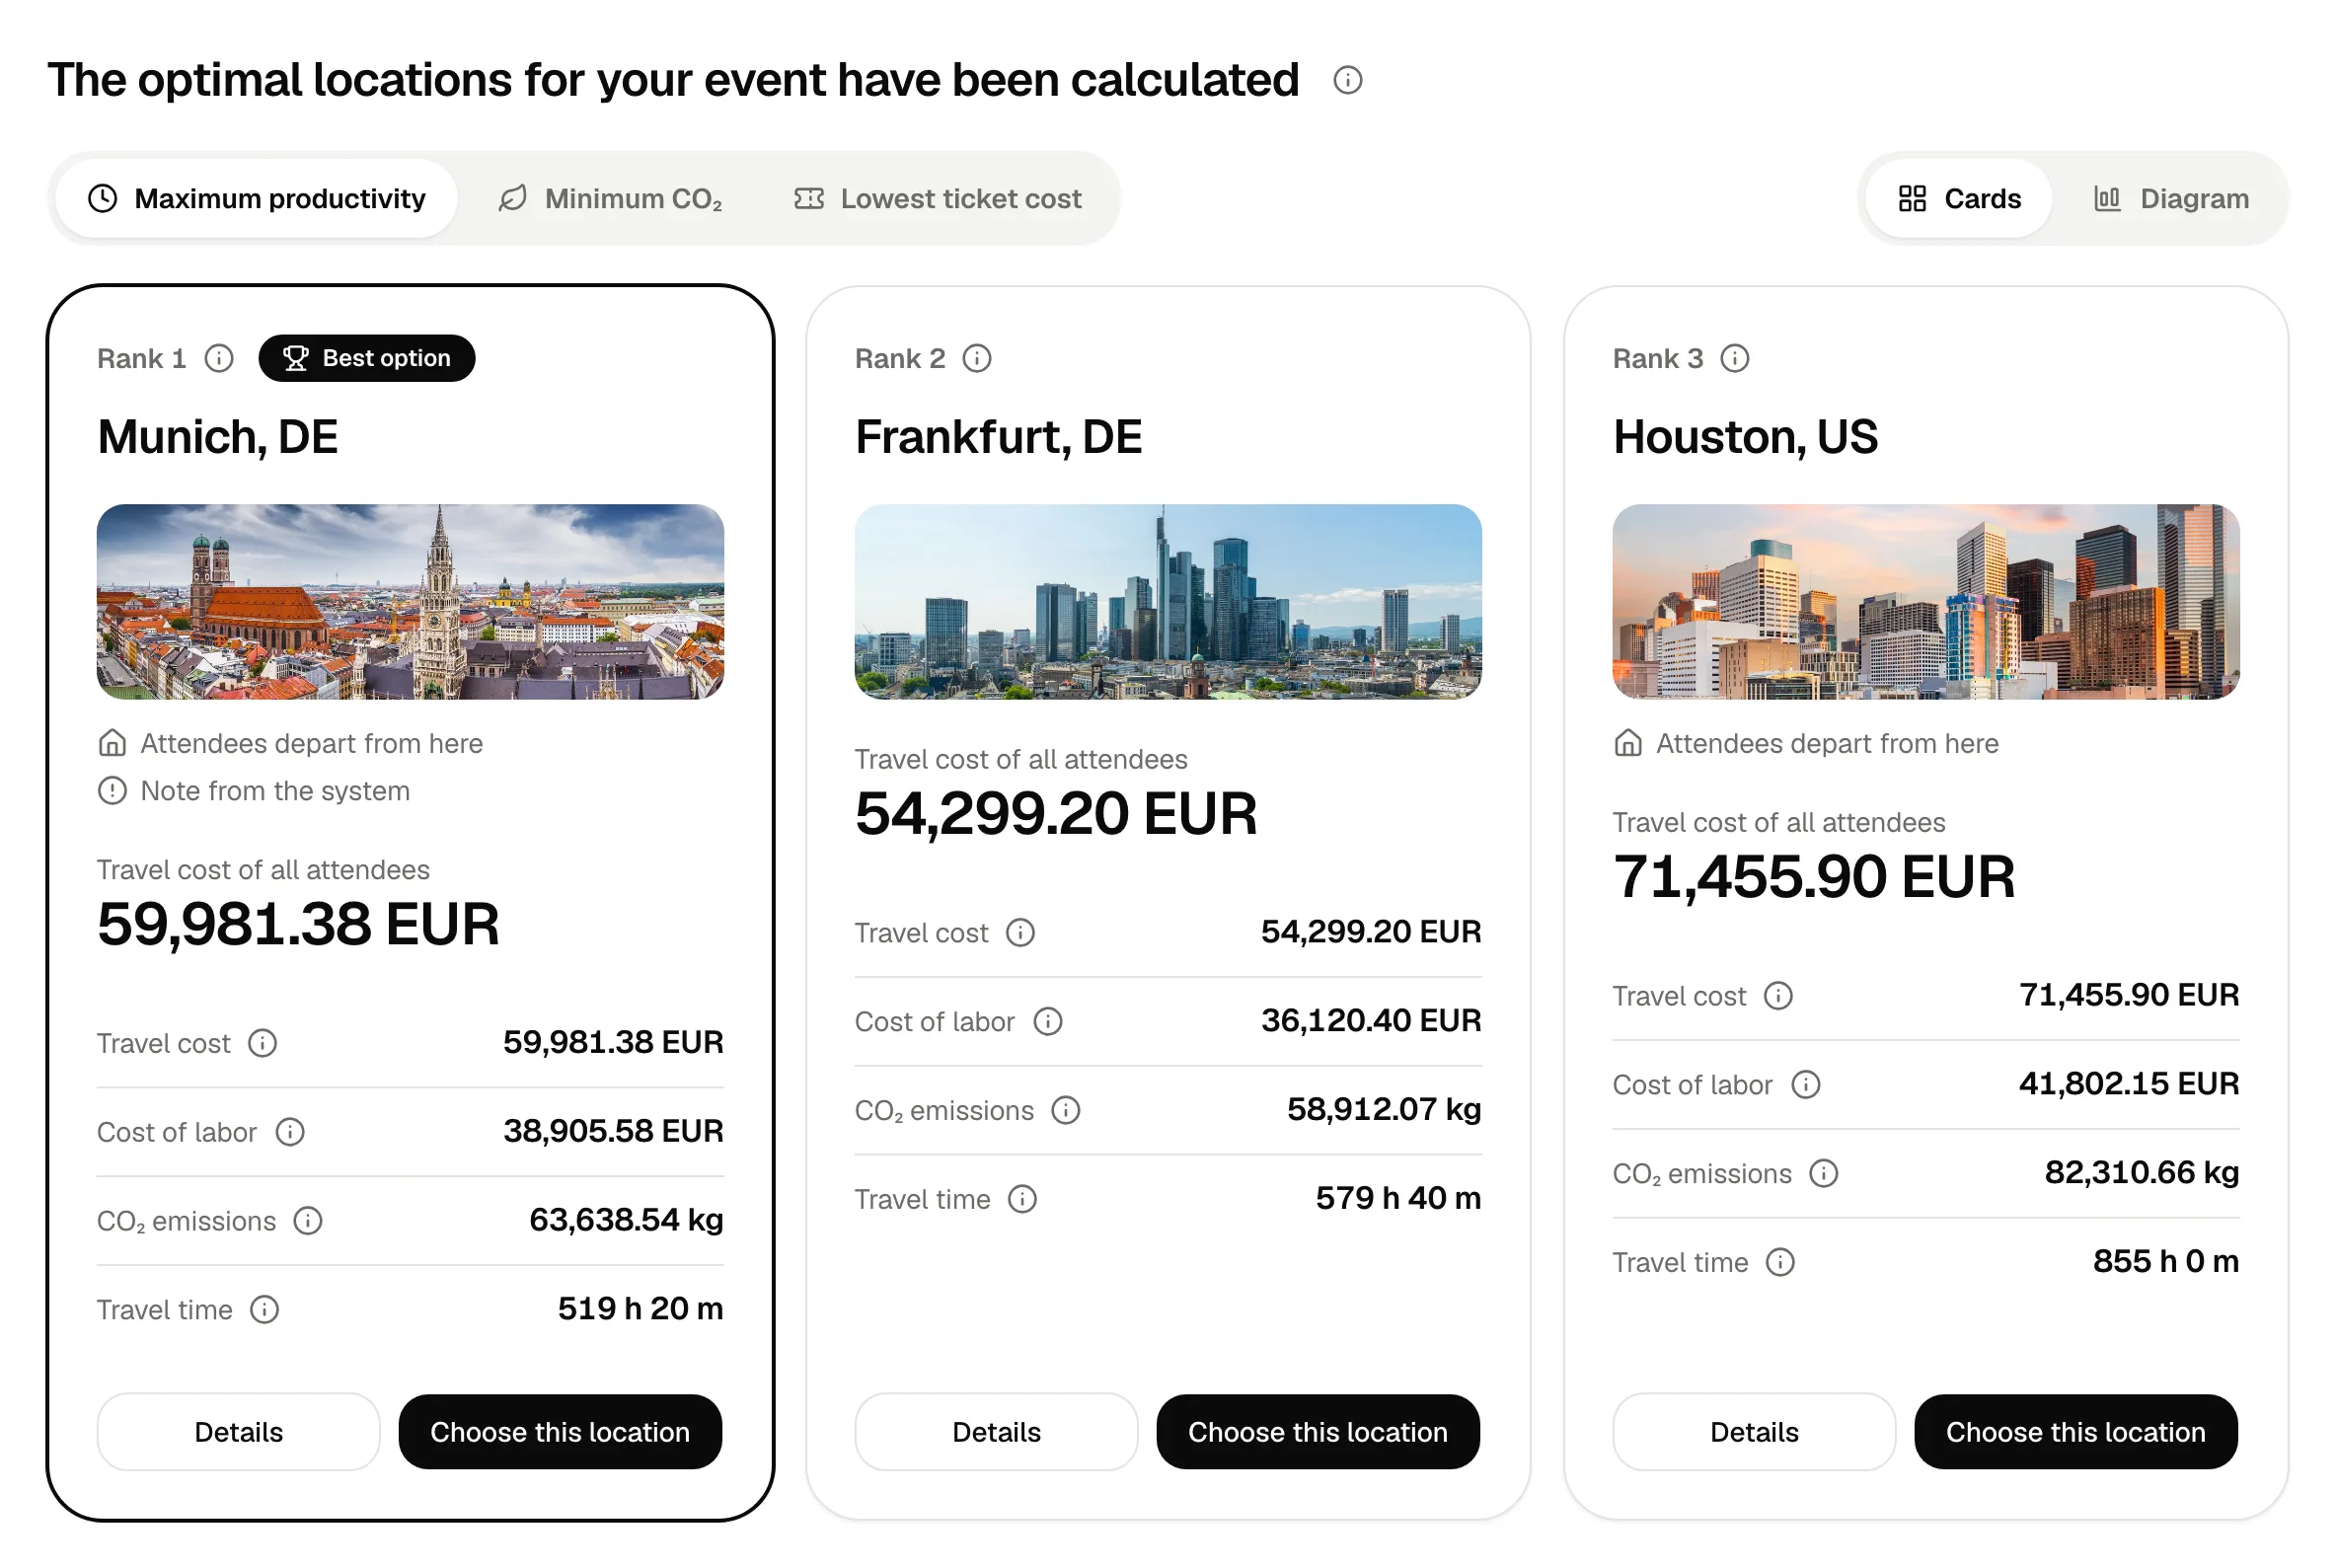
Compare cost, CO2 and travel time in three views, choose your location, export the report.
Inputs
Origins, not people.
We only need where your attendees start and how many travel from each place. No names, nothing personal.
- Origins A postcode, a city or an airport, with the head count and travel class for each.
- Dates Up to three dates for one event: the second costs 30% less, the third 50% less.
- Your benchmark Your preferred location, the basis for every comparison.
- Where to search The region or the cities we compare.
How we calculate
Three numbers per attendee, from live data.
For every candidate city we build each attendee's trip door to door, then add up cost, CO2 and time for the whole group.
Travel cost
Real flight schedules and fares from global booking systems, rail, bus and car through routing services, with your travel policy and negotiated rates.
CO2
atmosfair data according to the VDR standard since the end of 2020, aligned with the GHG Protocol (Scope 3, category 6), radiative forcing shown, for every mode.
Travel time
Time in transit, stops, waiting and the way to the station or airport, so the working time lost on the road shows next to the ticket price.
Ranking
Pick the view that fits your goal.
Maximum productivity, minimum CO2 or lowest ticket cost: one click re-ranks the cities. Every city shows travel cost, cost of labor, CO2 and travel time.
Savings
Compared on the same basis.
The chosen location against your preferred location, in the same calculation, in euros, tonnes and hours.
- Ready for your reporting Travel cost and CO2 saved, with CO2 figures per meeting for your Scope 3 reporting.
- Exported As PDF or Excel, for your team and your sustainability report.